
As Visual Capitalist's Jeff Desjardins notes, today’s chart from HowMuch.net uses this data to show all major economies in a visualization called a Voronoi diagram – let’s dive into the stats to learn more.
THE WORLD’S TOP 10 ECONOMIES
Here are the world’s top 10 economies, which together combine for a whopping two-thirds of global GDP.
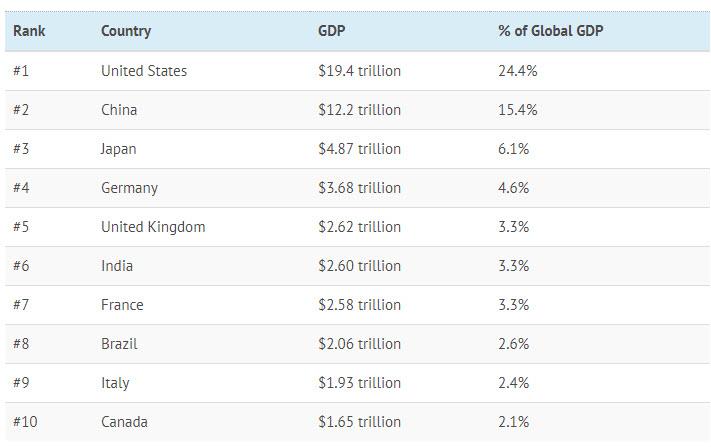
In nominal terms, the U.S. still has the largest GDP at $19.4 trillion, making up 24.4% of the world economy.
While China’s economy is far behind in nominal terms at $12.2 trillion, you may recall that the Chinese economy has been the world’s largest when adjusted for purchasing power parity (PPP) since 2016.
The next two largest economies are Japan ($4.9 trillion) and Germany ($4.6 trillion) – and when added to the U.S. and China, the top four economies combined account for over 50% of the world economy.
1 comment:
GDP is misleading because it doesn't include the shadow economy (black market, etc) which is a large part of many economies, especially the poorer, agrarian, and higher taxed economies. The shadow economy is why people in poor countries can survive on official incomes of only $20 a year. I really doubt that the US GDP is that much higher than the rest of the world.
Post a Comment